Enterprise Dashboard
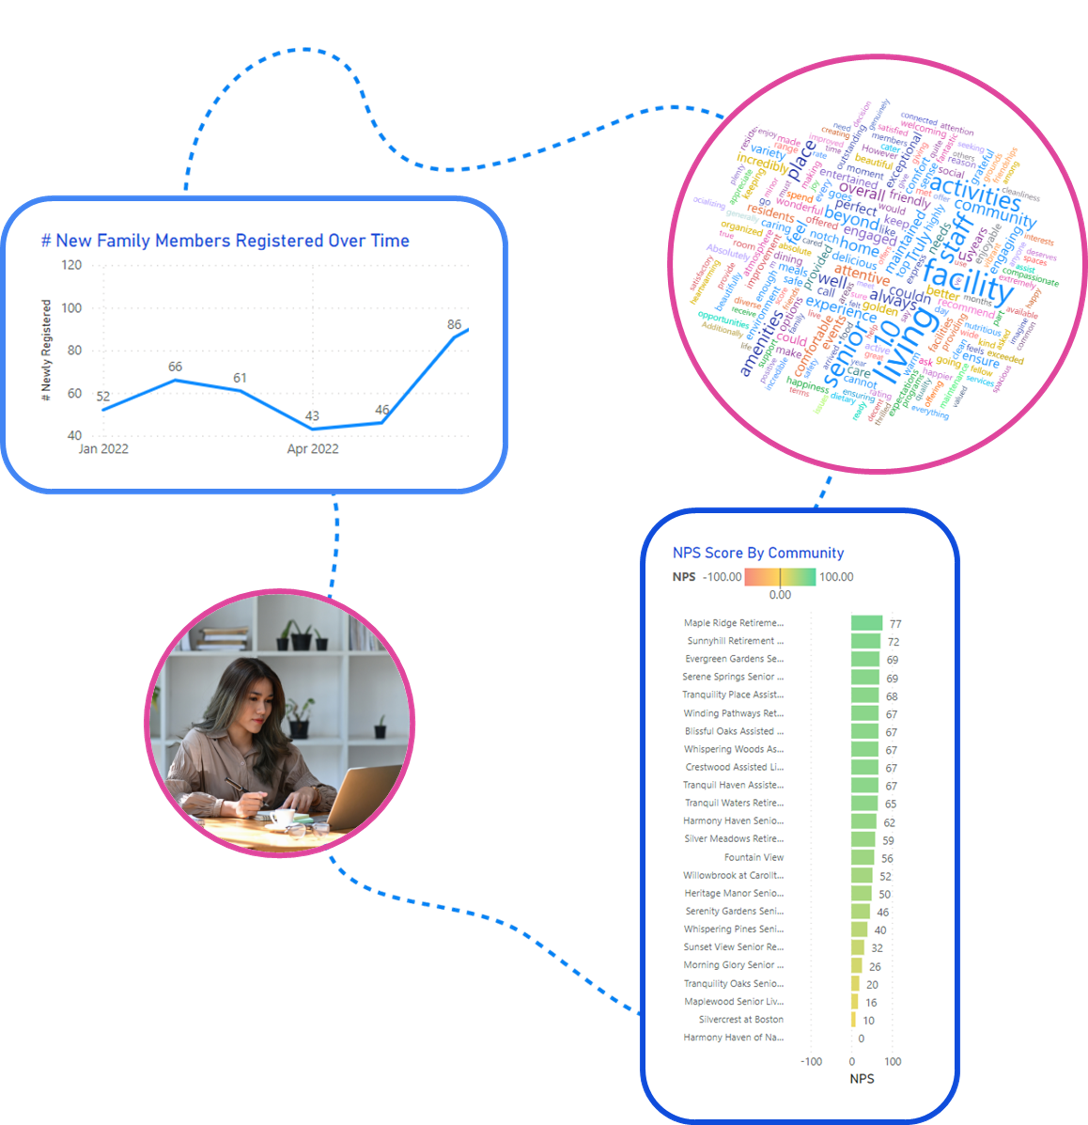
Reporting and Analysis Across All Your Communities
Gain valuable insights, streamline reporting processes, and make informed decisions with a centralized view of all your communities. Explore Enterprise Reporting and revolutionize your data analysis.
![](https://goicon.com/wp-content/uploads/2023/08/Enterprise-4.png)
Easily analyze trends, patterns, and KPIs, to identify opportunities, mitigate risks, and align strategies with real-time insights.
![unnamed (2)](https://goicon.com/wp-content/uploads/2022/08/unnamed-2-e1663950293247-300x191.png)
![unnamed (1)](https://goicon.com/wp-content/uploads/2022/08/unnamed-1-300x193.png)
![unnamed](https://goicon.com/wp-content/uploads/2022/08/unnamed-e1663950337658-300x192.png)
Previous image
Next image
Centralized Visibility Across All Communities
Analyze Life Enrichment Program Effectiveness
View Trends to Identify Areas of Improvement ​
Drill Down by Community to Identify Top Performers and Best Practices​
Understand the Voice of Your Customer by Analyzing Resident and Family Feedback​
![](https://goicon.com/wp-content/uploads/2023/06/Formerly-VoiceFriend-9-e1687467316175-1024x968.png)
Visually Explore and Compare Key Data:
- Attendance and Participation
- Dimensions of Wellness
- Event Categories
- Net-Promoter Surveys
- Engagement and Adoption
The Enterprise Dashboard Includes:
- Dynamic and Interactive Visuals
- Graphs and Table Views
- By Region and By Community Filtering
- Time Series and Benchmarking Visuals
- Text Based Analysis
- Advanced Filtering
![](https://goicon.com/wp-content/uploads/2023/08/Untitled-design-2023-08-30T095047.570.png)